10 Metrics to Track in a Capital Raising Pipeline
 Jacob BlackettLast Updated: Oct 26, 2026

TL;DR
- A capital raising pipeline is measured stage by stage, from first contact through soft commitment to funded investor.
- Ten metrics cover it, from prospect sources and lead scores at the start to repeat investors after the raise closes.
- Time from soft commitment to wire deserves the closest watch, because that is where sponsors tend to lose limited partners (LPs).
- Each metric here comes with a definition and a way to measure it, and the comparison that matters is a sponsor's own trend across raises.
- Every metric depends on one investor record that logs contacts, deal page activity, follow-up and commitments in the same place.
- Scoring leads before a raise opens uses the same data, so the team knows whom to call first on launch day.
Measure a real estate capital raising pipeline stage by stage, from first contact to funded investor, and compare each raise with your own earlier raises. A capital raising pipeline is the set of prospective investors a sponsor is moving through a raise, from first contact to funded commitment. Pipeline metrics show where prospects stall and which investors come back for the next deal.
What a Capital Raising Pipeline Measures
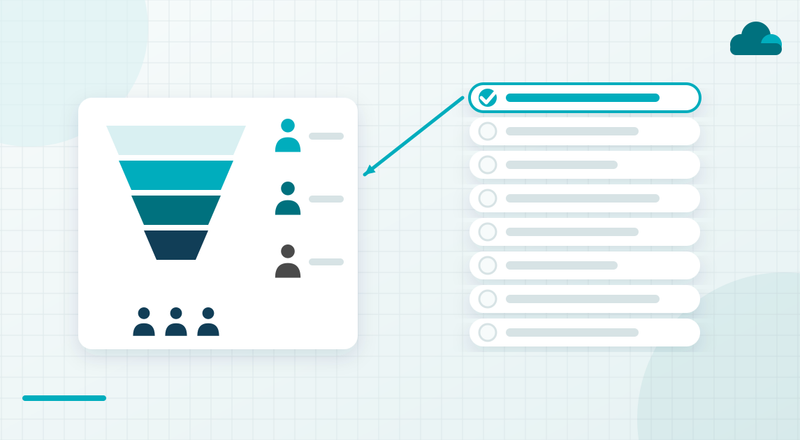
A capital raising pipeline shows how far each prospect gets in a raise and how long each step takes. The pipeline can be described in five stages, and every metric below refers back to them.
- Prospect, a potential investor with a record and no engagement on this deal yet
- Engaged, a prospect who has replied or opened the deal materials
- Soft commitment, an indicated amount that is generally non-binding, often called a soft circle
- Subscribed, an investor who has signed the subscription documents
- Funded, an investor whose wire has arrived
The full pipeline is often hard for a sponsor's team to see. Contacts sit in inboxes and commitments sit in a spreadsheet, so nobody holds the whole raise at once. Measuring by stage lets a small team see the raise end to end without adding people to watch it.
How We Chose These Ten Metrics
We chose each metric against three tests.
- It covers a distinct stage of the pipeline.
- It can be measured from data a sponsor already collects.
- It points to an action the team can take.
The page gives definitions and methods only, with no benchmark or target value for any metric. Conversion and timing depend on each sponsor's investor base, so the useful comparison is the sponsor's own previous raise.
The Ten Metrics at a Glance
The table maps each metric to its pipeline stage and to the place its data comes from.
| Metric | Pipeline Stage | What It Measures | Where the Data Lives |
|---|---|---|---|
| Prospects by Source | Prospect | New prospects per origin | Prospect records |
| Lead Score Distribution | Prospect | Prospects in each score band | Scores on prospect records |
| Deal Page Engagement | Engaged | Deal page views and opens | Investor activity tracking |
| Time to First Follow-Up | Engaged | Inquiry to first reply | Timestamps on the record |
| Follow-Up Response Rate | Engaged | Replies per message sent | Message log by channel |
| Stage Conversion Rate | Every stage | Share reaching the next stage | Stage history on records |
| Soft Commitments Against Raise Target | Soft commitment | Soft-circled dollars against target | Commitments recorded on the deal |
| Time From Soft Commit to Wire | Soft commitment to funded | Days from commitment to funds | Commitment and wire dates |
| Commitment Fall-Off | Soft commitment to funded | Soft-circled dollars never funded | Commitments and funded amounts |
| Repeat Investor Rate | Funded | Funded investors from earlier deals | Investment history on record |
Ten Capital Raising Pipeline Metrics
Each metric below follows the same four parts, an overview, the calculation, the data source and the signal a change sends.
Prospects by Source
Prospects by source counts new prospects added in a period, split by where each one came from. It is suited to the months before a raise opens, when the team decides where outreach time goes.
How to Calculate It. Count new prospect records per source for the period, such as referrals or a deal page.
Where the Data Lives. The source field on each prospect record, filled in when the record is created.
What a Change Tells the Team. Outreach effort should follow the sources that produce funded investors. A source that adds many prospects and few funded ones needs a second look.
Lead Score Distribution
Lead score distribution shows how many prospects sit in each score band before and during a raise. It is suited to the weeks before launch, while there is still time to build engagement.
How to Calculate It. Group prospects by the score on each record and count each band.
Where the Data Lives. The score on each prospect record, built from engagement signals and profile data.
What a Change Tells the Team. Few prospects in the highest band before launch tells the team to build engagement before the raise opens.
Deal Page Engagement
Deal page engagement counts the prospects who viewed a deal page or opened offering materials, per deal. It is suited to the first days of a raise, when the team needs to know who is reading.
How to Calculate It. Count distinct prospects with a page view or document open on the deal, kept separate for each deal.
Where the Data Lives. Investor activity tracking, which logs views and opens on the investor record as they happen.
What a Change Tells the Team. The prospects reading the deal are the ones to follow up with first. Low engagement points to the page or to the list it went to.
Time to First Follow-Up
Time to first follow-up measures the gap between a prospect's first inquiry and the team's first reply. It is suited to raises run by a small team, where replies slow as volume rises.
How to Calculate It. Subtract the inquiry timestamp from the first reply timestamp for each prospect, then review the median for the raise.
Where the Data Lives. Timestamps on the investor record, provided inquiries and replies are logged there.
What a Change Tells the Team. A rising median is an early sign the team is stretched during the raise.
Follow-Up Response Rate
Follow-up response rate is the share of follow-up messages that get a reply, split by channel. It is suited to sponsors who reach investors by email and by text.
How to Calculate It. Divide replies by messages sent for each channel.
Where the Data Lives. The message log on each investor record, with the channel noted.
What a Change Tells the Team. A falling rate points to the message or its timing.
Stage Conversion Rate
Stage conversion rate is the share of investors who move from one pipeline stage to the next. It is suited to every raise, because it shows which stage holds the most stalled investors.
How to Calculate It. Divide the investors who reached a stage by the investors who reached the stage before it, for each step on every raise.
Where the Data Lives. Stage history on the investor record, with the date each investor entered each stage.
What a Change Tells the Team. The stage with the lowest conversion is where the process needs attention first.
Soft Commitments Against Raise Target
Soft commitments against raise target measures soft-circled dollars as a share of the raise target. It is suited to the open phase of a raise, when the team decides whether to keep marketing or move to closing.
How to Calculate It. Add the soft commitment amounts recorded against the deal and divide by the raise target.
Where the Data Lives. Soft commitment amounts logged on the deal and on each investor record.
What a Change Tells the Team. Read it alongside commitment fall-off, since soft commitments are generally non-binding.
Time from Soft Commit to Wire
Time from soft commit to wire measures the days between a recorded soft commitment and received funds, per investor. It is suited to the closing weeks of a raise and deserves the closest watch of the ten.
How to Calculate It. Subtract the soft commitment date from the date funds arrived for each investor.
Where the Data Lives. Two dates on the investor record, the soft commitment and the wire receipt.
What a Change Tells the Team. Sponsors tend to lose LPs in this stretch, when the process starts to feel improvised. A lengthening figure deserves a look at the hand-offs, and the guide to turning soft commitments into funded capital covers them in detail.
Commitment Fall-Off
Commitment fall-off measures soft-circled dollars that never fund. It is suited to the review after a raise closes.
How to Calculate It. Subtract funded amounts from soft commitments for the raise, with a reason logged for each investor where the team knows it.
Where the Data Lives. Commitment and funding amounts on the investor record, with a reason field.
What a Change Tells the Team. The logged reasons point to the step that failed, which makes them the most useful part of the figure.
Repeat Investor Rate
Repeat investor rate is the share of funded investors in a raise who also funded an earlier deal with the sponsor. It is suited to sponsors on their second raise or later.
How to Calculate It. Divide repeat investors by all funded investors for the raise.
Where the Data Lives. Investment history on the investor record, which needs earlier deals and the current raise in one place.
What a Change Tells the Team. LPs remember how a raise was run and whether reporting held up afterwards. A falling rate points back at the last raise and the reporting since.
How to Score Investor Leads Before a Raise Opens
Score each prospect on engagement signals and profile fit before launch, then call the highest band first. A simple lead score draws on signals like these.
- Deal page views
- Document opens
- Replies to follow-up
- Attendance at an investor webinar
- Earlier investments with the sponsor
- Stated check size
- Accreditation status
Keep the model simple enough for the team to explain in a sentence. Group the scores into bands, and treat the result as a starting order for calls that the team's judgment can adjust. Scoring is one part of how to raise capital faster for a real estate syndication, because launch day starts with the call list already in order.
Revisit the weights after each raise. Commitment fall-off and stage conversion show which signals came before a funded commitment, so the next model reflects what happened on the last one.
Tracking Pipeline Metrics Without Adding Headcount
The metrics work when contacts, deal page activity, follow-up and commitments land on one investor record, usually in a customer relationship management (CRM) system built for raising capital. When each sits in a different tool, someone has to rebuild the pipeline by hand before any metric can be read.
Spreadsheets hold up for a first raise with a short list. They stay workable until volume makes version control the job, and activity such as deal page views never reaches the sheet. Ask what the sheet looks like at the next raise.
Sponsors judge their systems by whether growth still requires adding people to do repetitive work. Real estate fundraising software with pipeline management and investor activity tracking keeps stages and activity on the investor record, so the metrics come from the record itself.
Where to Start Measuring Your Pipeline
Start with stage conversion and time from soft commit to wire. Those two show where investors stall during an open raise, and the rest can follow as the data allows.
The SponsorCloud Growth Suite brings lead scoring, investor activity tracking, automated follow-up and pipeline management together in one capital raising CRM. SponsorCloud's investor CRM software keeps that record as part of an investor platform built for commercial real estate sponsors. To see your own pipeline measured stage by stage, schedule a consultation with SponsorCloud.
Pipeline numbers matter most as a trend across a sponsor's own raises, where each one shows whether the process improved since the last close.
FAQs
What Is a Capital Raising Pipeline?
A capital raising pipeline is the set of prospective investors a sponsor is working toward a commitment, organized by stage. Typical stages run from prospect to engaged, soft commitment, subscribed and funded. Tracking the pipeline by stage shows the team how much capital is likely to close and where investors are stalling before the raise deadline.
Which Pipeline Metric Matters Most During a Raise?
Time from soft commitment to wire usually tells a sponsor the most once a raise is open. It shows how long committed investors wait between saying yes and funding, which is the stretch where sponsors tend to lose LPs. Pair it with stage conversion so the team can see which step is holding investors up.
What Is a Good Conversion Rate for a Real Estate Raise?
A sponsor's own history is the better yardstick. Conversion depends on the investor base, the deal, the minimum investment and how warm the list is, so a figure from another sponsor tells you little. Measure conversion by stage on every raise and compare each raise with the last one to see whether the process is improving.
How Do You Score Investor Leads Before a Raise Opens?
Score each prospect on engagement and fit. Engagement signals include deal page views, document opens, webinar attendance and replies to follow-up, and fit covers earlier investments with the sponsor and the check size the prospect has indicated. Call the highest band first at launch and revisit the weights after each raise using what actually funded.
What Is a Repeat Investor Rate?
Repeat investor rate is the share of funded investors in a raise who also funded an earlier deal with the same sponsor. It reflects how the last raise and the reporting since were run, because LPs remember the process. Track it per raise from the investor record, which needs prior investments and the current raise in one place.
Can a Sponsor Track Pipeline Metrics in a Spreadsheet?
A spreadsheet works for a first raise with a short list. As prospects and deals multiply, keeping one accurate version becomes the job, and activity such as deal page views never reaches the sheet. A capital raising CRM logs activity and commitments on the investor record as they happen, so the metrics come from the record itself.

Jacob Blackett
CEO and Co-Founder, SponsorCloud
Jacob Blackett is the CEO and co-founder of SponsorCloud. He raised capital and ran commercial real estate as a sponsor before he built software for other sponsors, and he still manages funds today. He built the platform that became SponsorCloud to solve problems in his own raises, tested it against real capital and real deadlines across his own portfolio, and then opened it to other GPs.
Related Signals